
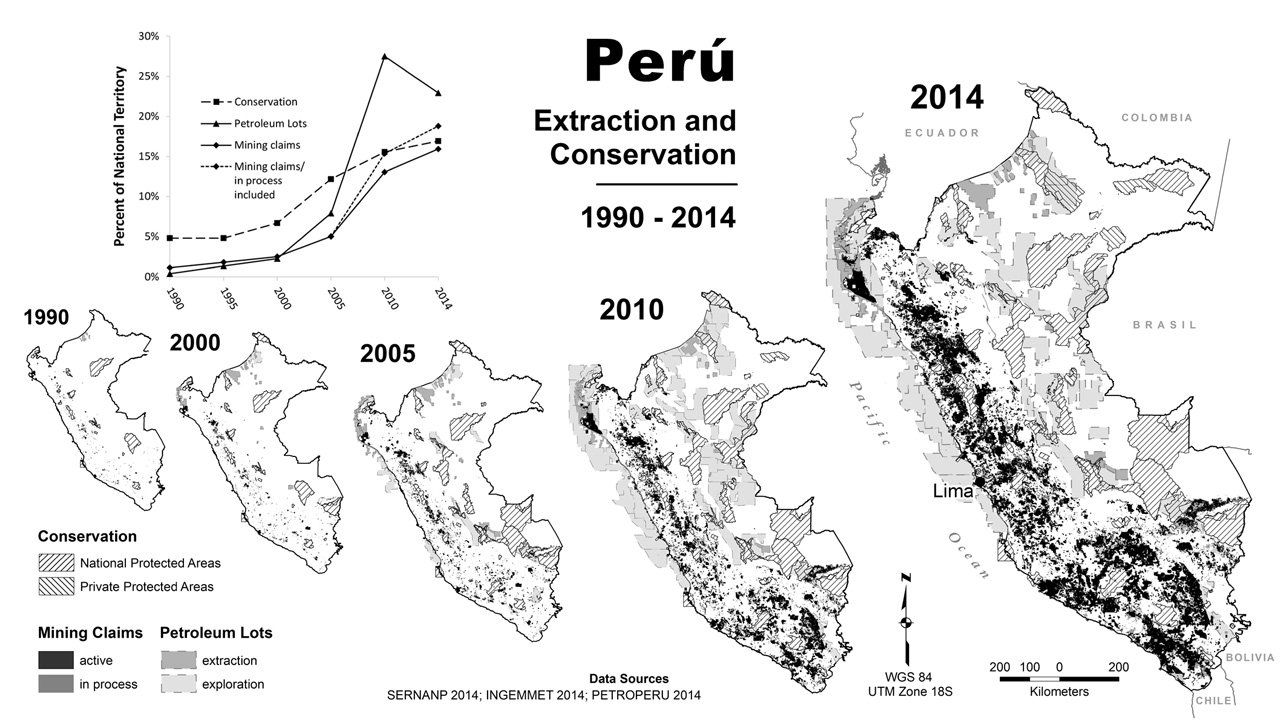

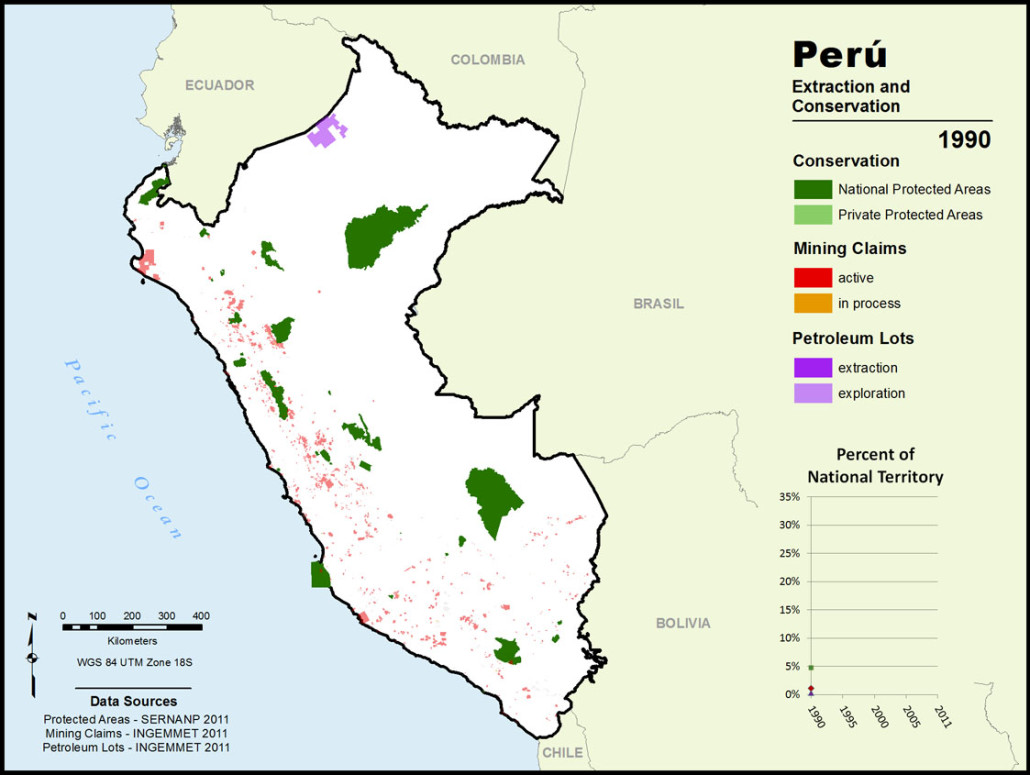
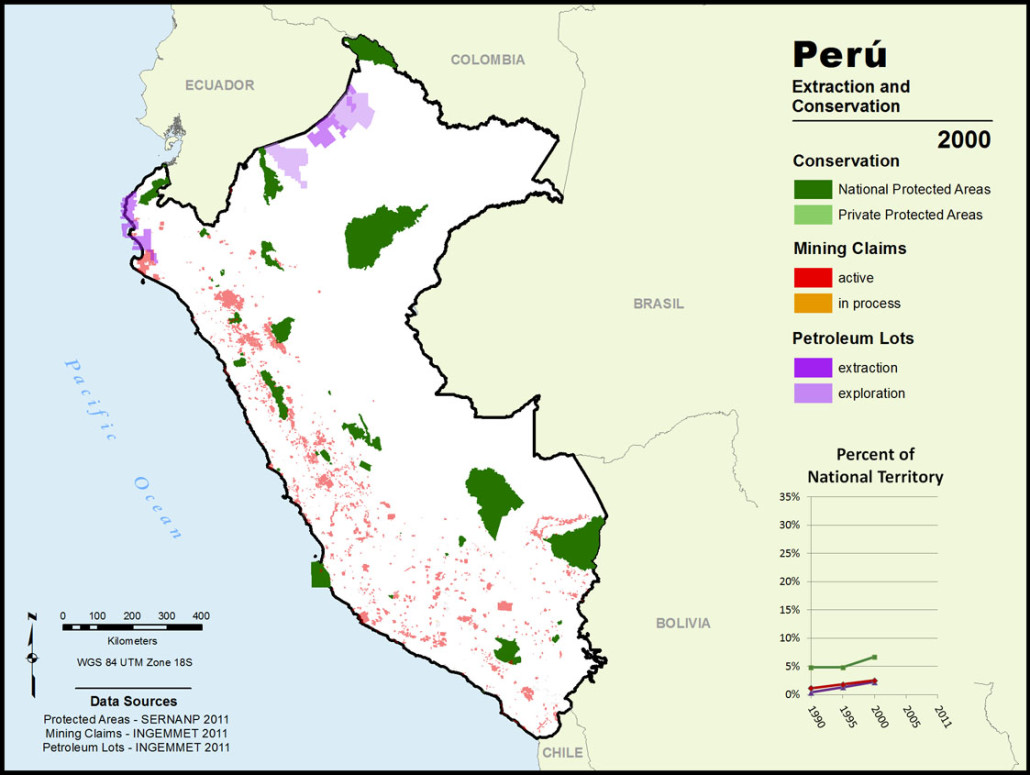
The amount of lands in Peru dedicated to conservation and mining respectively have grown with very similar trajectories over the last two decades. This animated map shows the geography of this growth visualized at five year intervals. This series of maps was originally designed for presentations of all sorts and has been used in academic conferences, public engagements in Peru (including the congress of Peru), and in a short documentary published by National Geographic (see also the longer version below).
 1990
1990
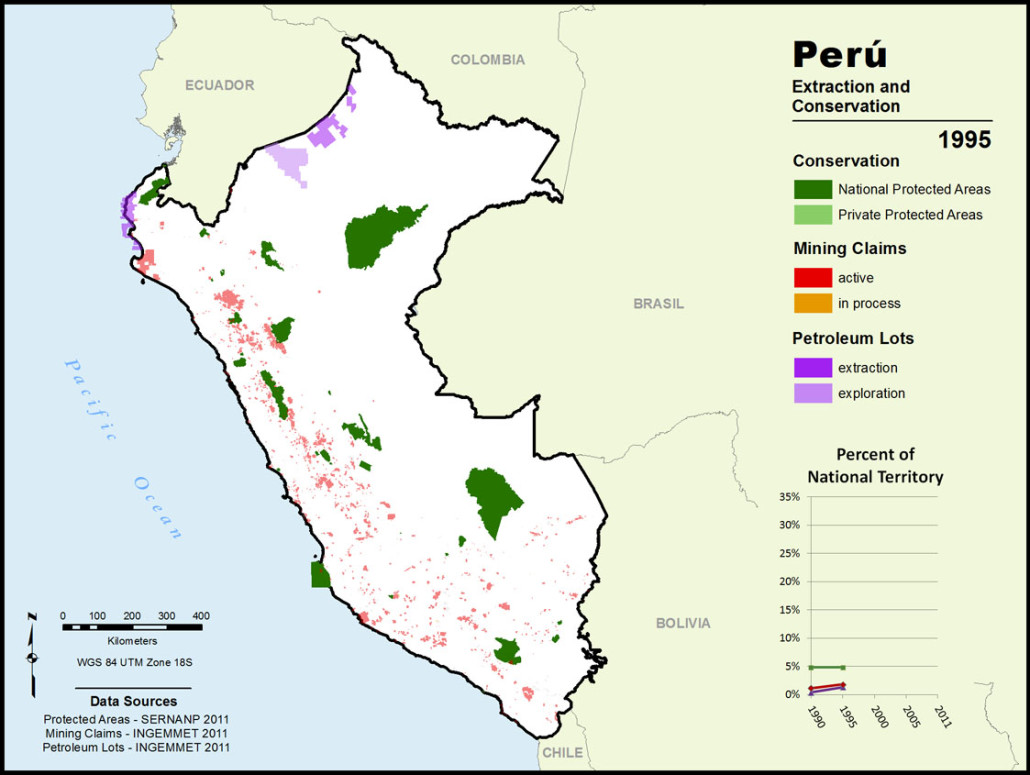
The data for the 1990s was hard to find, but with persistence in Lima over several years, it became available. Now the data is online at geocatmin, a system maintained by the Ministry of Energy and Mines (MINEM).
The GIS was first constructed in ArcMap and then the coverage data was aggregated and exported for the graph. The final layouts were constructed ArcMap, exported and then finished in Photoshop.