
Virtu is an online map viewer and data explorer designed to work with model output from the Ichthyop Model, a Lagrangian tool for simulating ichthyoplankton dynamics. This work is through the Center for Computational Science at the University of Miami in collaboration with the NOAA Southeast Regional Office. In November of 2018 the beta release will be tested by resource managers around the Gulf of Mexico, but the viewer is not yet available to the public. The Ichthyop Model uses HYCOM data to predict drifter paths; in this case the drifters are recently born turtles. The model also incorporates limited behavioral characteristics in certain “zones of Influence.” The ouput of the model is track data contained in NetCDF files, one file for each model run. The data can reach several gigabytes for a scenario of replicated model runs.
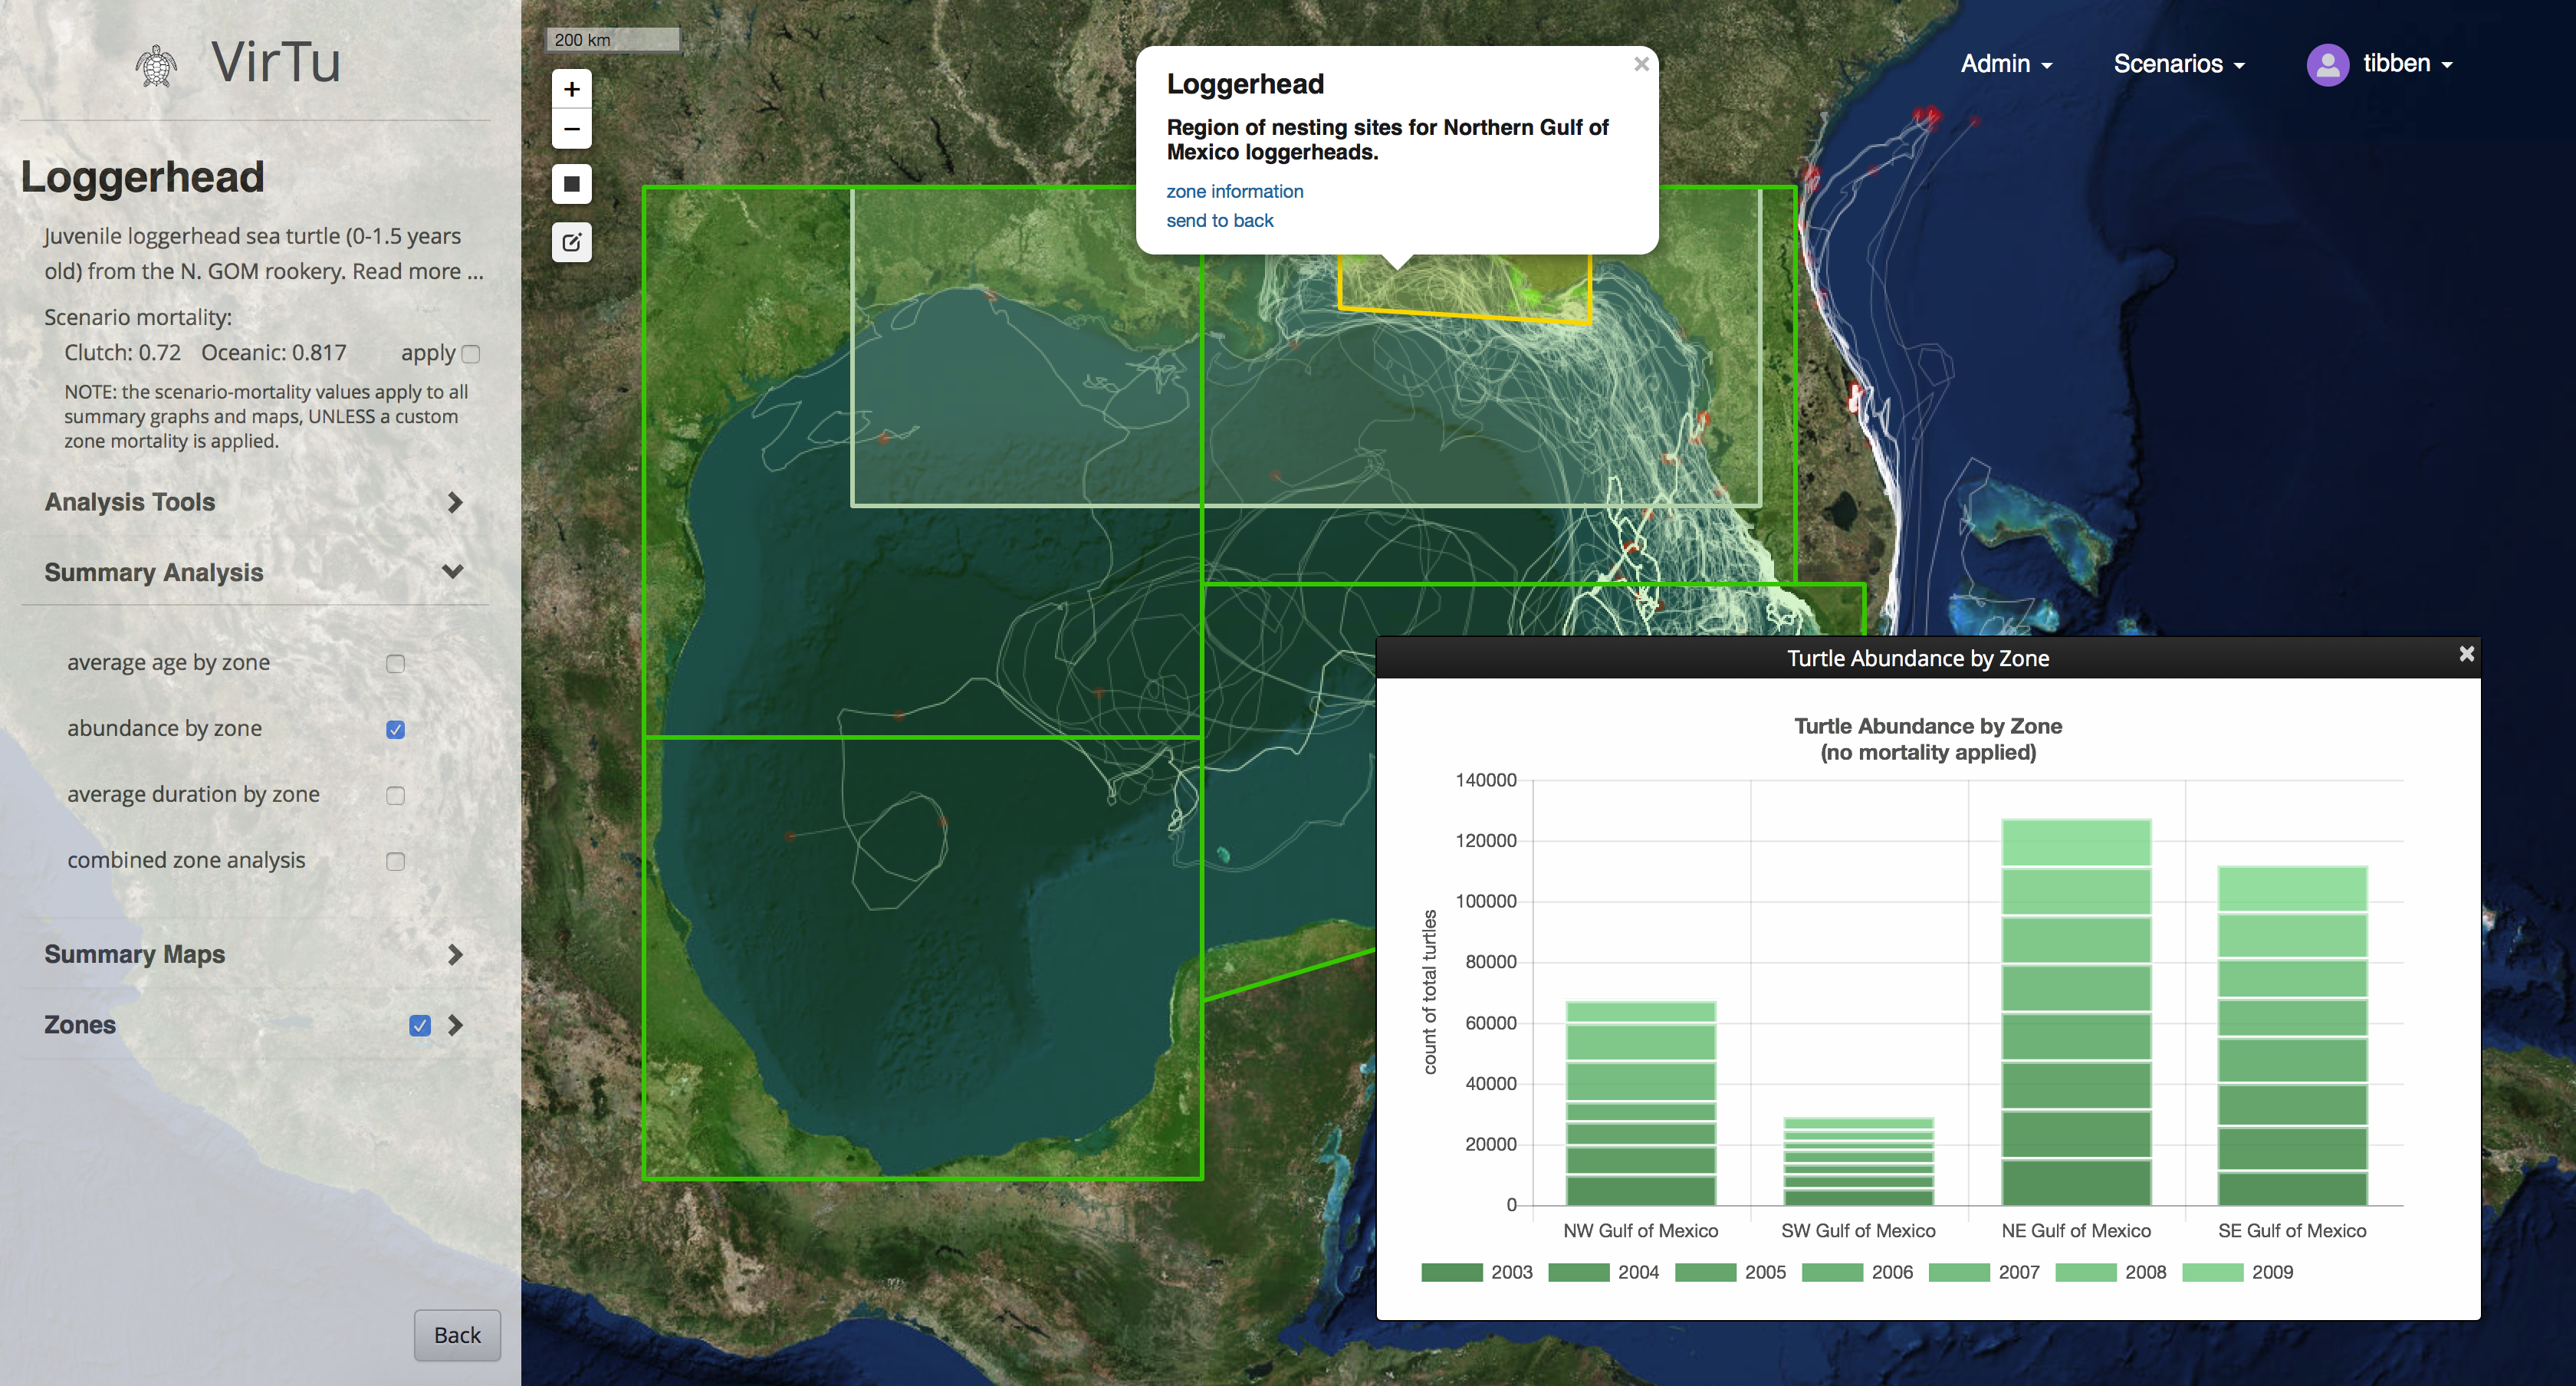
A screenshot showing the model zones, a graph of aggregated turtle (particle) abundance, and several example “tracks” of the turtles in the model (particles).
VirTu, the online viewer, is built on a PEAN technology stack: postgresSQL, javascript express, angularJS, and nodeJS (the latter three are javascript tools). This stack allows for almost all of the code to be written in Javascript (both the front and back ends). While this has served fairly well, some of the heavy lifting for the data aggregation and visualization uses SQL and Python at the back end. On the front end almost all of the visualization is run by the leaflet javascript mapping library in conjunction with the ChartJS library to build dynamic graphic capabilities.
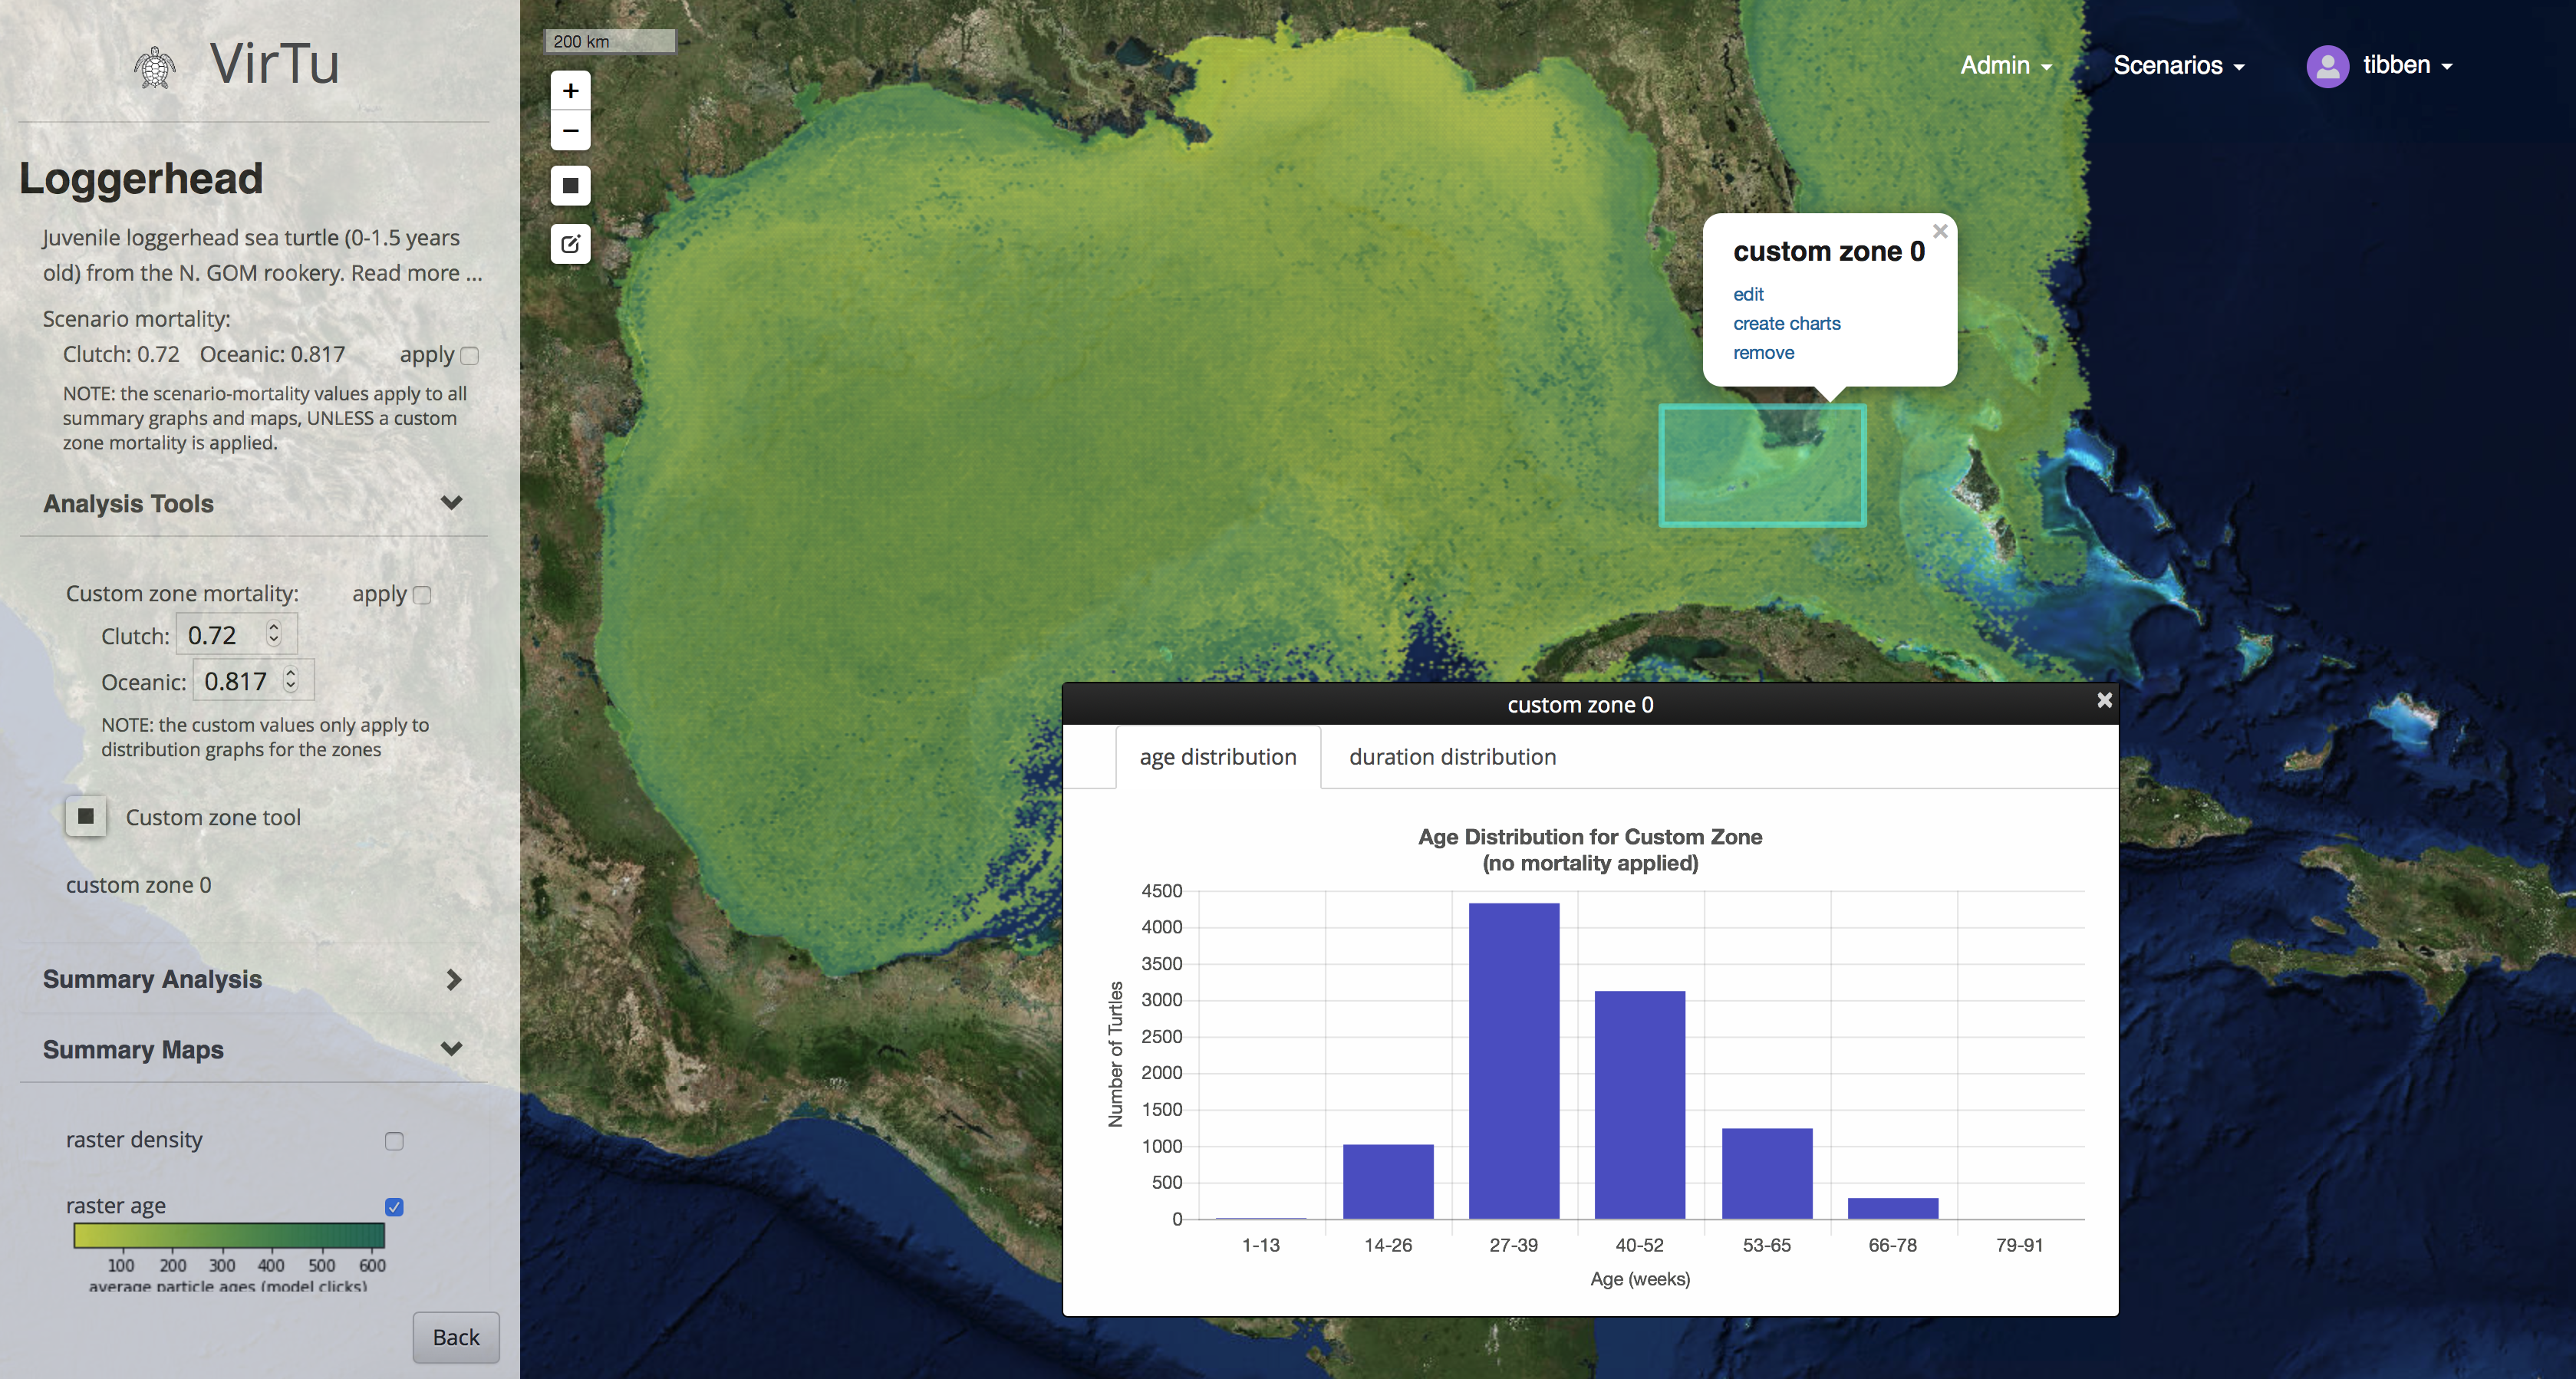
One of the features that has the resource managers excited is the ability to create custom zones and query Gigabytes of underlying model output data in real time.
One of the more interesting back end features, from a cartographic perspective, is how to make the raster tiles to display the turtle densities using the leaflet javascript library. The implementation starts with Python 2.7 and a NetCDF library. All of the data, several gigabytes, is munged into a giant numpy array and then fed to the matplotlib hexbins function to create one large image representing the densities. Then the GDAL Proj4 libraries in conjunction with the OGR/GDAL libraries are used to write a geotiff that is correctly referenced using the metadata from the original NetCDF files. One the geotiff is created then the GDAL to tiles function is used to rip tiles at various zoom levels. The entire pipeline is automated an can be initiated from within a web browser.
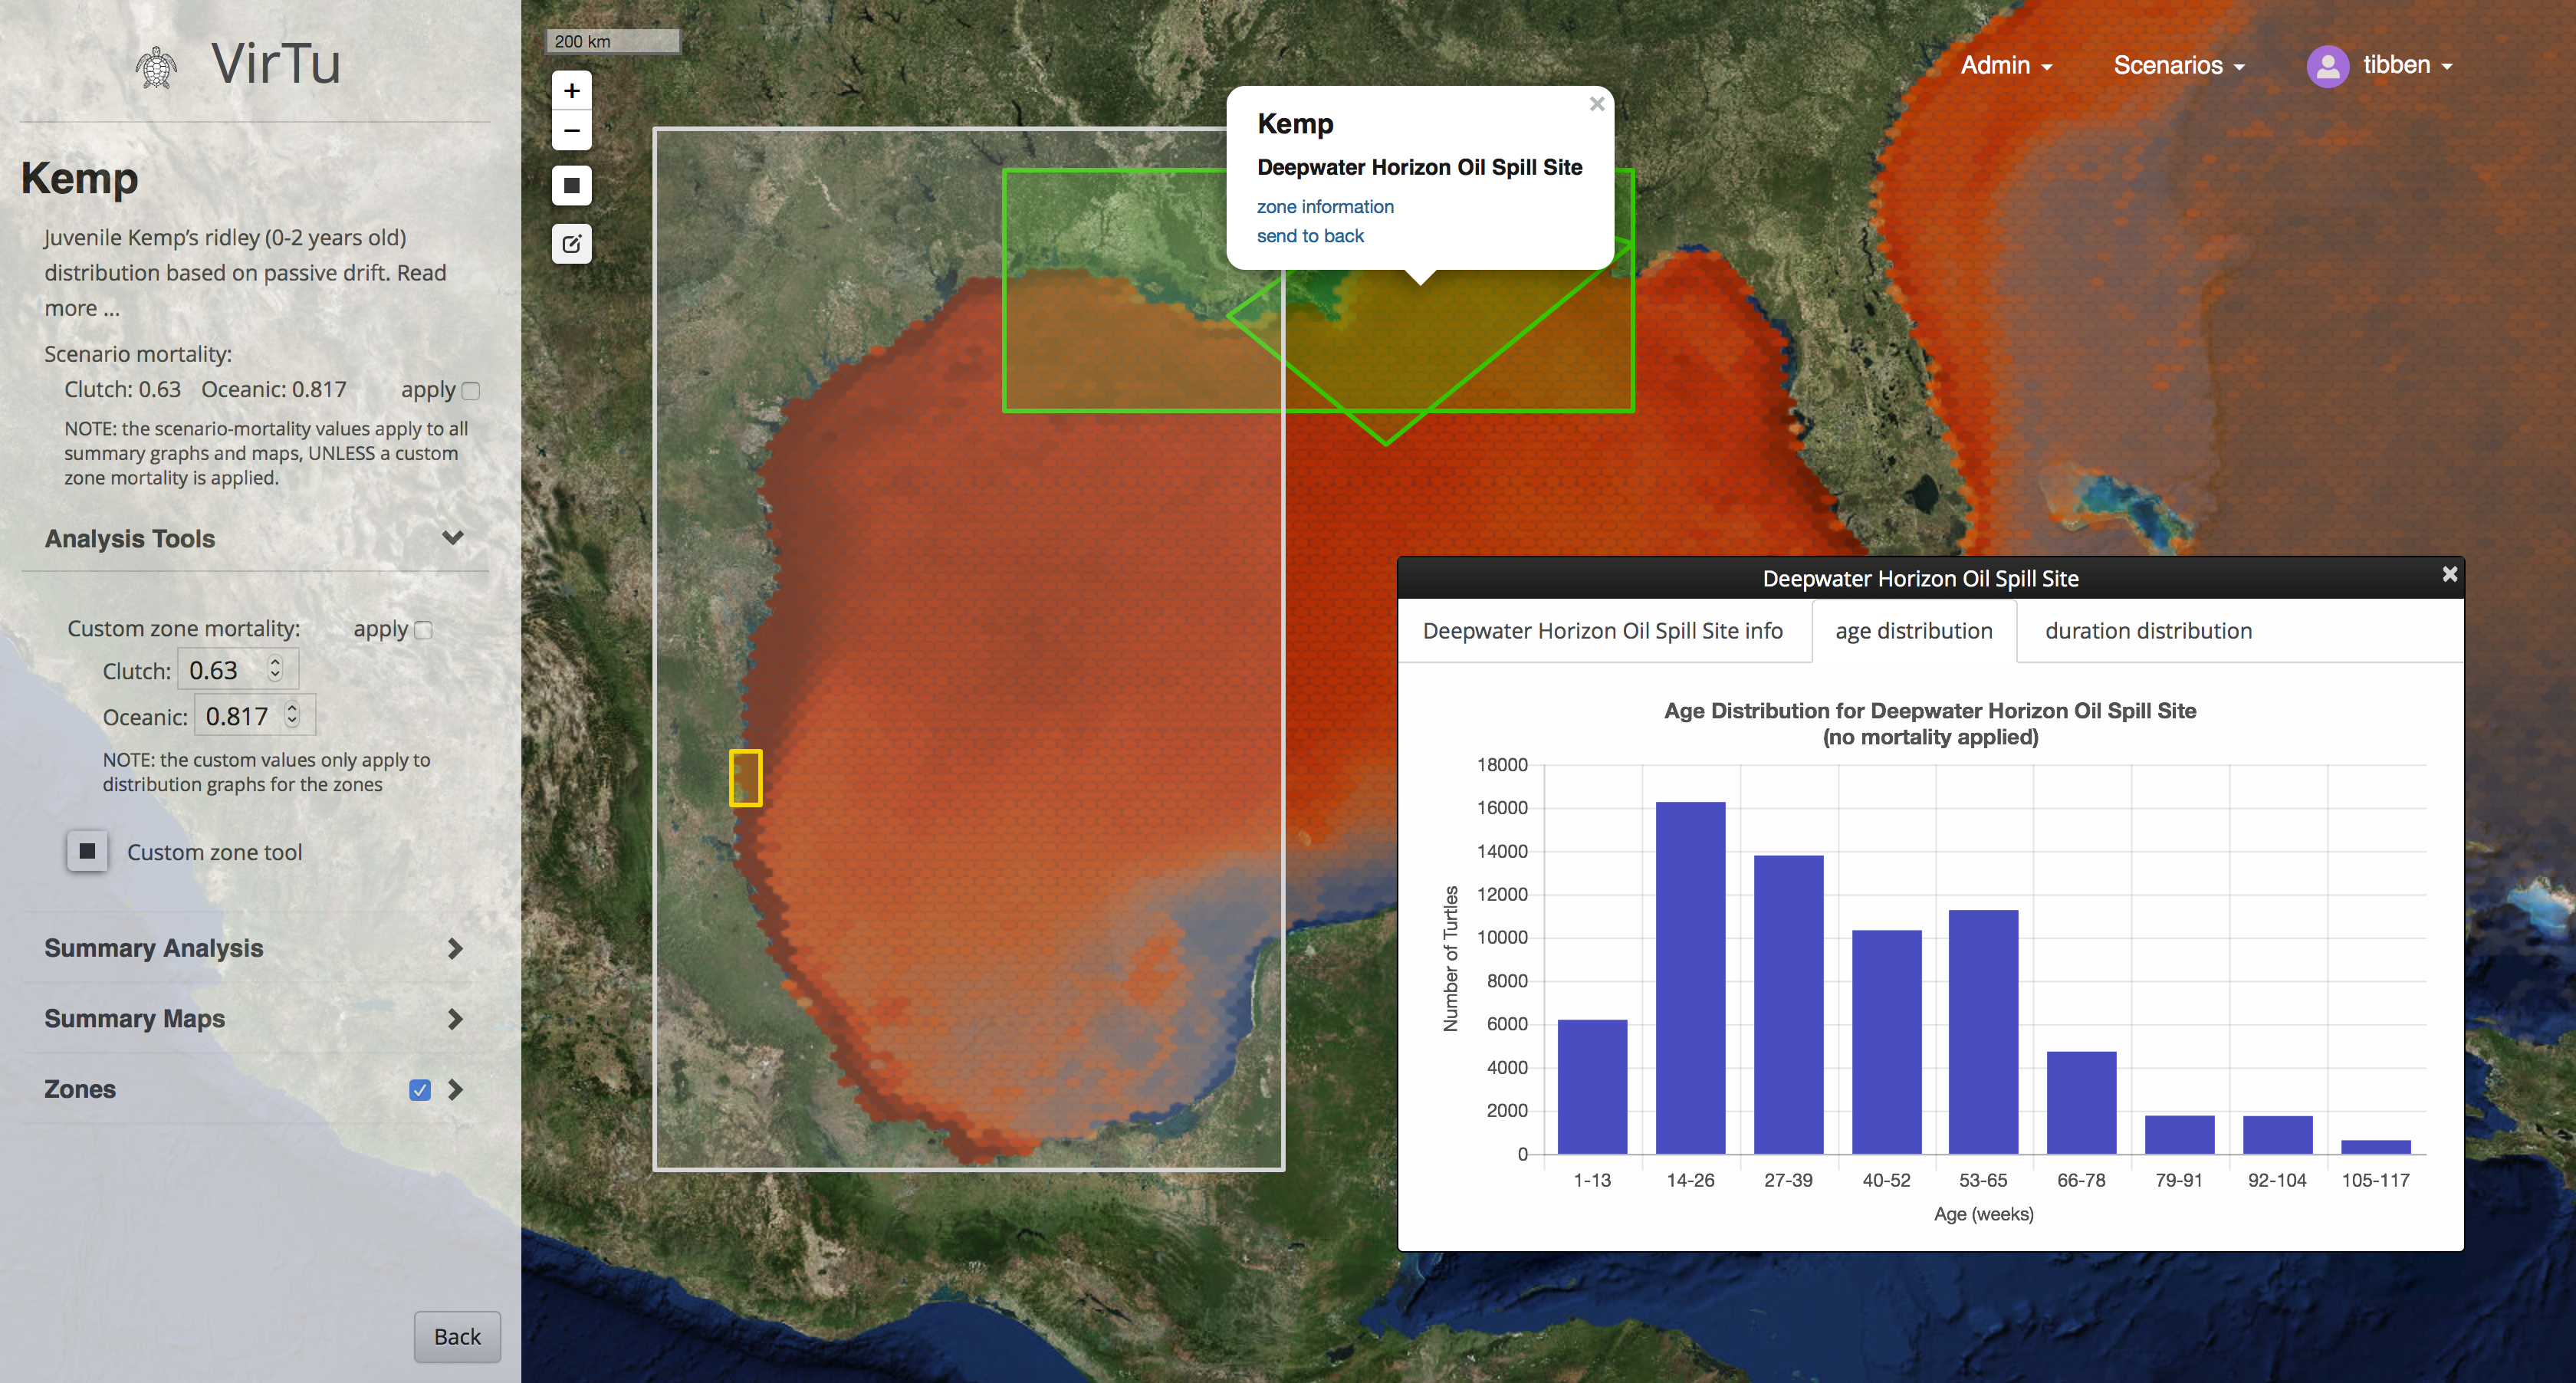
The map viewer showing raster density tiles alongside a plot that shows the age distribution of the particles (turtles) in a particular zone.